

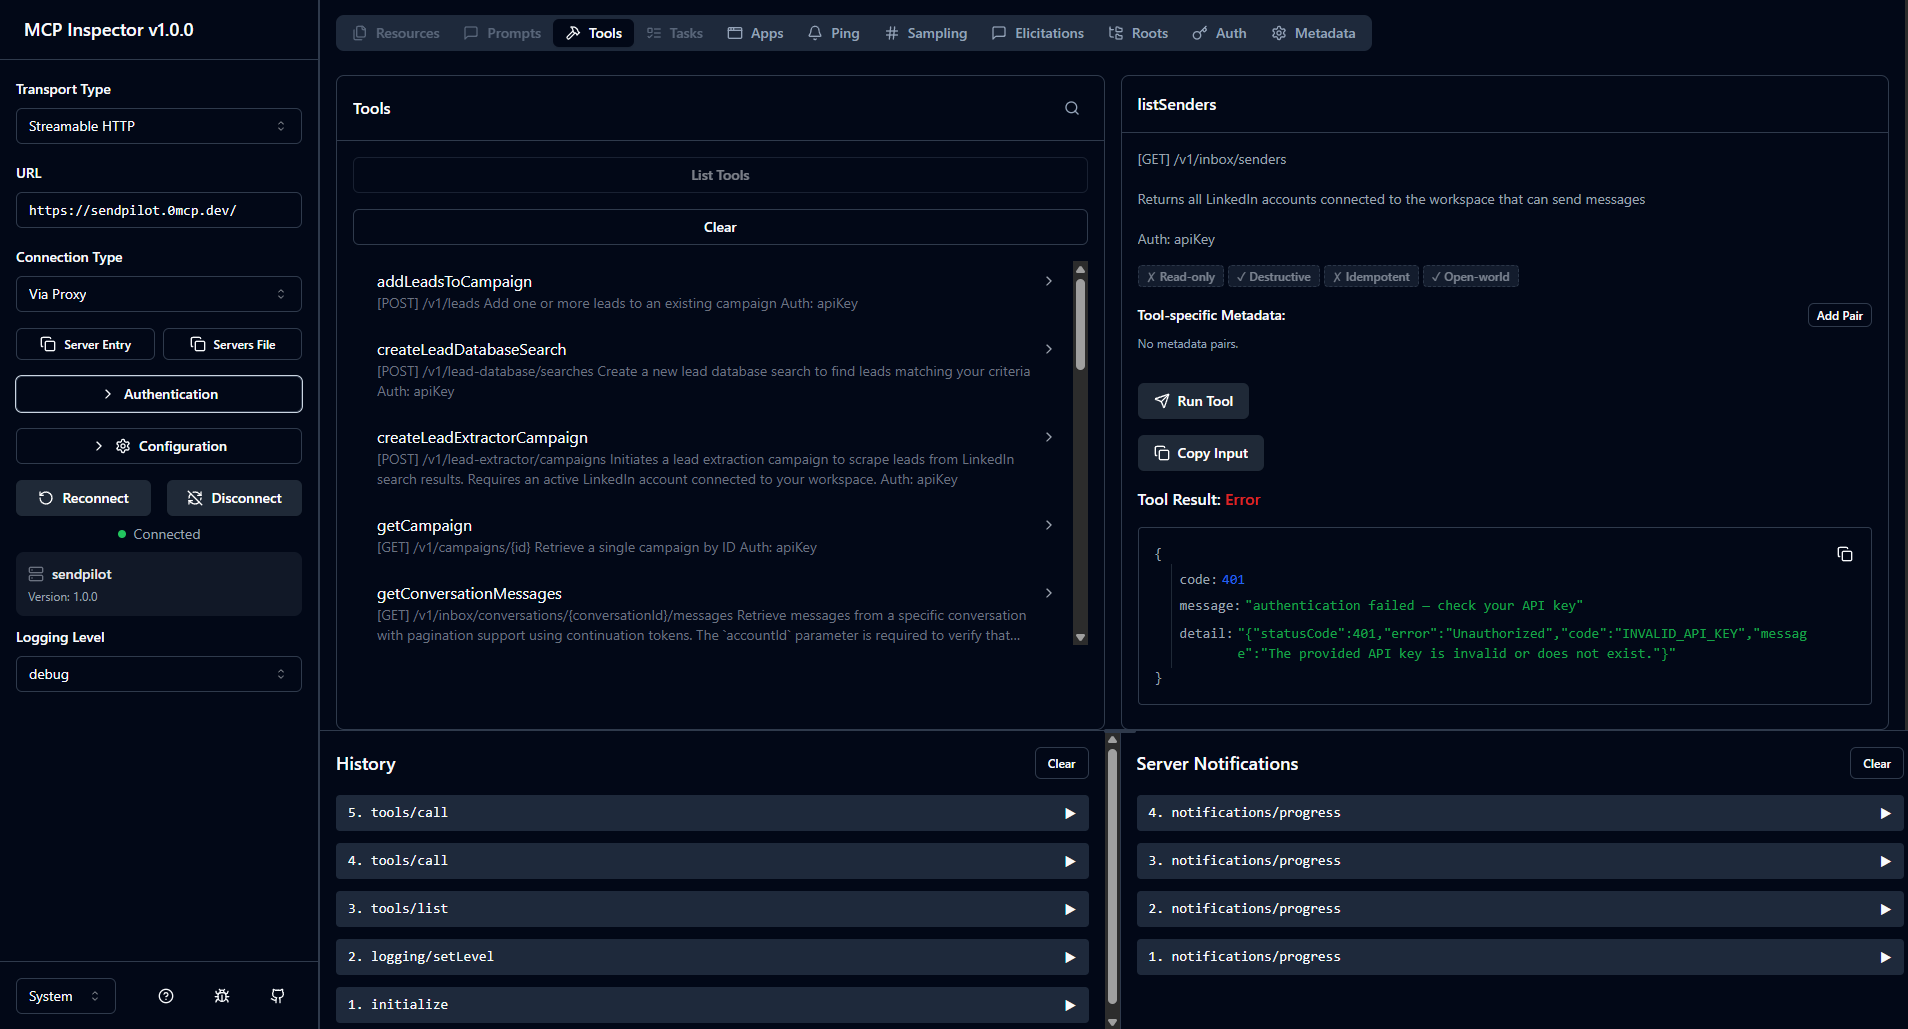
When to use MCP Inspector
Use Inspector when you need to:- Verify that a server starts
- Test initialization
- Check the selected transport
- Review tool names and schemas
- Call a tool with controlled input
- Inspect resource contents
- Preview prompt templates
- View notifications and logs
- Diagnose protocol errors
- Test changes before opening an AI client
Requirements
You need:- Node.js and
npx - A local server startup command or remote MCP URL
- Any required environment variables or authentication credentials
Start MCP Inspector
Run:uv:
Connect to a local server
For a local MCP server:- Select the
STDIOtransport. - Enter the executable command.
- Add command arguments.
- Add required environment variables.
- Click Connect.
Connect to a remote server
For a remote MCP server:- Select Streamable HTTP.
- Enter the full MCP endpoint URL.
- Configure authentication if required.
- Click Connect.
Inspect tools
Open the Tools tab to:- List available tools
- Read their descriptions
- Inspect input schemas
- Enter arguments
- Execute a tool
- Review the raw result
- Valid input
- Missing required input
- Invalid types
- Boundary values
- Empty results
- Upstream failures
- Authorization failures
- Timeouts
Inspect resources
Open the Resources tab to:- List resources
- Review names, URIs, descriptions, and MIME types
- Read resource contents
- Test resource templates
- Test subscriptions when supported
Inspect prompts
Open the Prompts tab to:- List prompt templates
- Review arguments
- Supply test values
- Preview generated messages
Read the notification and log panes
Inspector displays protocol events and server logs. Use them to confirm:- Initialization completes
- The expected protocol version is selected
- Capabilities are declared
- Request IDs match responses
- Progress notifications are valid
- Errors use the expected structure
stdout in a stdio server. Use stderr so log text does not corrupt MCP messages.
Debug common failures
Connection refused
- Confirm the remote URL and port
- Verify the server is running
- Check firewall and proxy rules
- Confirm TLS configuration
Local process exits
- Run the command directly
- Check file paths and dependencies
- Verify environment variables
- Inspect
stderr
Transport mismatch
UseSTDIO for a process command and Streamable HTTP for a modern remote endpoint. Legacy servers may still use the older SSE transport.
Initialization fails
- Compare supported protocol versions
- Validate the initialize response
- Check capability shapes
- Confirm the initialized notification
Tool validation fails
- Review the input schema
- Test required properties
- Remove ambiguous or unsupported schema constructs
- Confirm argument names match the implementation
Authentication fails
- Check token validity and scope
- Confirm required headers
- Verify the OAuth flow
- Avoid logging the credential
A practical testing workflow
- Start with successful initialization.
- Confirm the capability lists.
- Test one read-only tool.
- Test invalid inputs.
- Test upstream errors.
- Test write operations in a safe environment.
- Test cancellation and timeouts.
- Connect a real AI client for end-to-end behavior.
- Add regression tests to CI.
What Inspector cannot prove
Inspector cannot prove that:- Every AI client supports the same features
- A model will select the correct tool
- Tool descriptions are understandable in every context
- Production authorization is correct
- The underlying API is reliable